This is one of a series of blogs in which we introduce AppScope 1.0 with stories that demonstrate how AppScope changes the game for SREs and developers, as well as Infosec, DevSecOps, and ITOps practitioners. In the coming weeks, Part 2 of this post will tackle another Infosec use case.
If you’re in Infosec, at some point you’ve doubtless had to vet an application before it’s allowed to run in an enterprise environment. The goal is to prevent data leaks or supply-chain security issues from occurring as a result of using the application. This kind of vetting is a standard part of the security procurement process.
The question is, What does the app do? Is it safe?
It takes a half-a-dozen-odd tools to get to the bottom of it: tcpdump, wireshark, strace, and debuggers, among others—each to capture something different.
Working in the debugger, where you’ll set breakpoints to copy data out of memory, is especially dicey. You may need to dump memory and do forensics to find strings.
Then, you’ll need to collate all the data together into a coherent summary and write up a report based on that.
One of the worst things is, when there is something nefarious, the scripts and data they operate on will be encrypted and compressed. You can’t see the data until it shows up in memory as the scripts are executing—too late!
AppScope changes this entire equation by making it easy to look at data other tools either can’t crack open, or can only show you in a laborious, painstaking kind of way.
In this blog, to see just how fast and efficient you can be with AppScope, we’ll dig into a popular tool that might well need to be vetted for use in an enterprise environment. The app we’ve picked is Visual Studio Code, or VS Code, as it’s usually called.
When you vet an app, your company’s lawyers will probably want to know whether the app sends telemetry. Does it phone home? And if so, what data is it sending?
This is about mitigating the threat that an app would exfiltrate data and steal code—a common scenario. For example, you add a library and it’s got code to grab your code and exfiltrate it. So the lawyers have good reason to be nervous about what information vendor products are sending out.
VS Code is a good example to investigate because it definitely sends telemetry data—we know this because its privacy settings allow you to disable telemetry reporting. But we have no idea what this telemetered data might contain beyond what the VS Code docs say.
So let’s use AppScope to dig into the VS Code process in detail, and especially to analyze what VS Code sends and receives over the network. Feel free to run this demo on your own gear if you are so inclined. We’ll be downloading and running VS Code on a Mac, and running AppScope in a sandbox on a Linux server.
The Setup
To begin, we get VS Code up and running with telemetry:
- Download and launch VS Code on the Mac.
- Install the Remote – SSH extension.
- Leave the Telemetry Level setting to “all”, allowing VS Code to send whatever telemetry data it sees fit.
Here’s how that looks on the settings screen in VS Code:

Attaching AppScope to the VS Code process
Now, with the Remote – SSH extension, we connect to our Linux server.
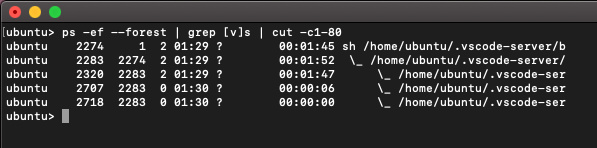
At this point, we see a set of new VS Code processes which weren’t there before we made the connection:
Okay. So what are these VS Code processes doing? It’s easy to use AppScope to find out.
First, we’ll do this:
- ssh into the Linux server.
- Download the AppScope binary as described here.
Now we can start our investigation by attaching AppScope to processes of interest, to see what they’re doing.
From the ps command in the previous screenshot, we see one VS Code process that spawns several others. It has a process ID of 2283. Let’s attach to that one:
ubuntu> sudo ./scope attach --payloads 2283

WARNING: Session history will be stored in /home/ubuntu/.scope/history and owned by root

Attaching to process 2283
That was easy, wasn’t it? Other things you can do with AppScope include starting a process with AppScope loaded inside it from the start; telling AppScope to stream events to a network destination instead of local files; and, enabling, disabling, or filtering specific events. We won’t use those capabilities in this exercise, but please keep them in mind when you think about where AppScope might help in your own use cases.
With our vanilla scope attach command, AppScope writes all the data it gathers from the process we attached to, to a directory named history on the local filesystem. We can look into this directory and see what VS Code is doing.
Looking at an HTTP event
AppScope can look at HTTP event output and capture HTTP payloads. We’ll use these features to see what is sent and received: both the HTTP requests and the data.
AppScope writes events to a file named events.json. Let’s grep that file, filtering for HTTP events, and displaying it in readable form by piping to jq:
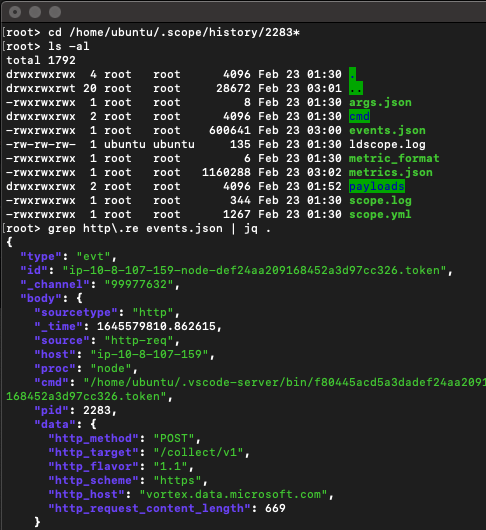
So what are we looking at here?
In the screenshot, we see the first HTTP event, which clearly shows that process 2283 has posted 669 bytes of information to https://vortex.data.microsoft.com/collect/v1.
But what’s in those 669 bytes? The data itself is not available from the file we’re looking at, whose purpose is to describe events. But with payload capture turned on (that is what the --payloads in our scope attach command does), AppScope will have written the raw unencrypted data to its payloads directory.
It’s important to note that this data was sent over an encrypted (HTTPS) connection. This would confound packet capture tools that look at data on the wire, as well as tools that run in the Linux kernel. But AppScope makes it easy to look at this data; as amazing as it sounds, AppScope doesn’t need to be configured with keys or certs to do that.
Looking at an HTTP payload
When we ran AppScope, it wrote every payload that it captured to a file in the payloads directory. These files contain raw incoming or outgoing data that was received or sent by the VS Code process.
Let’s cd into the payloads directory and run ls -al:
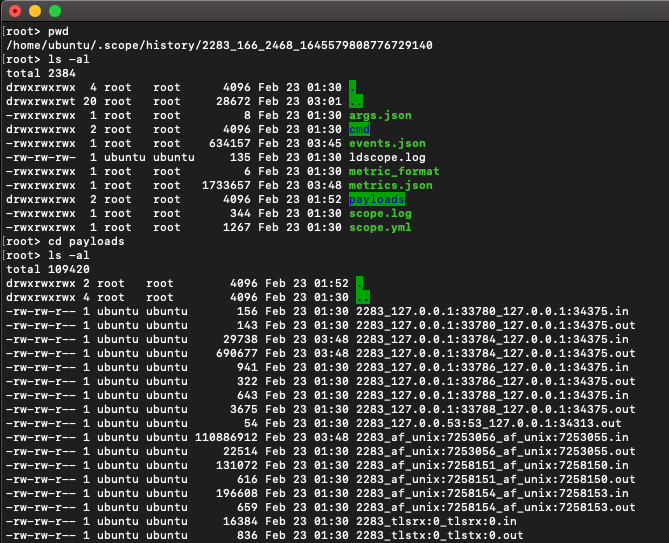
The payload at the bottom of the screenshot is the one we want to dig into. Its filename, 2283_tlstx:0_tlstx:0.out, indicates that it was an outgoing payload sent over TLS by process 2283.
The TLS part means that the payload was sent over an encrypted connection. We might expect that to make the payload unreadable to us. But here we come to another remarkable thing about AppScope: fundamentally, AppScope works by interposing functions, and can see the data that those functions operate on. In this case, AppScope interposes the TLS functions that encrypt the payload as it goes out on the wire—and this means that AppScope can see the payload before it gets TLS-encrypted. So the fact that VS Code is using TLS does not mean we can’t see the payload contents with AppScope.
We’ll inspect the payload with a venerable Unix command-line utility, head:
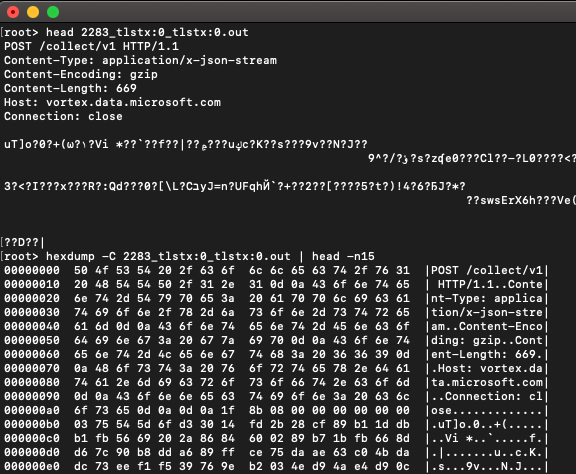
What do we see?
Beyond some initial information that’s clearly the same HTTP event description we saw before with jq, there is data … but it looks all garbled!
Initially frustrated, we take a closer look, and notice the Content-Encoding: gzip HTTP header. Apart from the TLS encryption we talked about earlier, this data is not encrypted, it’s just gzip-compressed! This might still lead somewhere!
Digging a little deeper
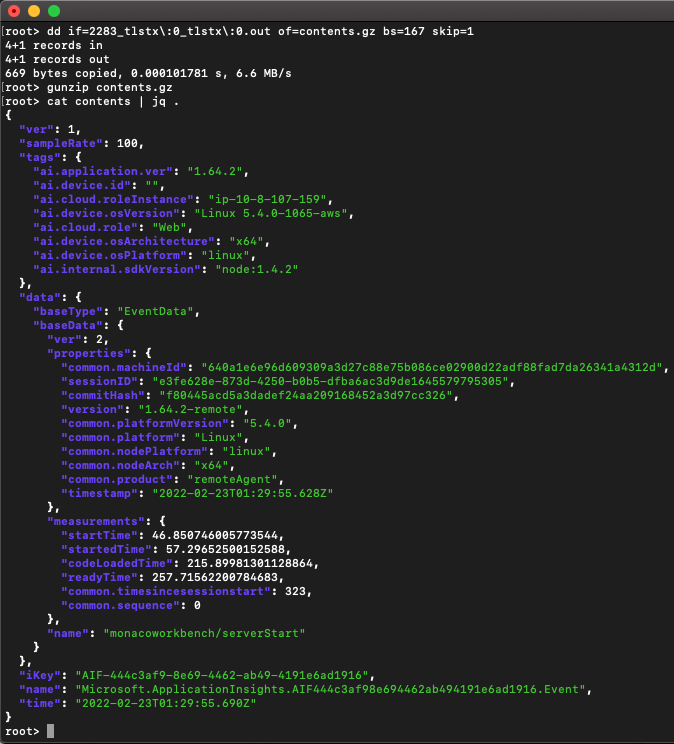
Now another ancient Unix command-line utility comes in handy: we’ll use dd to read from the file of interest and output to a file we’ll name contents.gz.
We’ll want to skip the first 167 bytes of data. We derive this value by taking the total size of the input file (836 bytes according to ls -al above) and subtracting the amount of data consumed by the Content-Length header (669 bytes).
Our dd command, then, looks like this:
dd if=2283_tlstx\:0_tlstx\:0.out of=contents.gz bs=167 skip=1
Next, we unzip the result and dump it to the console, and we see … A JSON file that is the uncompressed payload that VS Code sent to the /collect/v1 endpoint! Yeah! We got it!
The Telemetry Payload Revealed
What can we see in the payload, then?
- The hostname of our Linux server’s hostname.
- The server architecture.
- Some IDs that presumably could be used to correlate this message with others VS Code sends as telemetry data.
Not exactly amazing top secret data, as it turns out—these are things that your organization would probably be comfortable with. Or perhaps not, depending on the organization’s security posture.
Stepping away from the specific contents of what we’ve found, the takeaway is that this quick, straightforward investigation with AppScope revealed exactly what telemetry data the application we’re vetting sends off into the interwebs. We don’t know of any other tool that can do this as easily.
You can imagine other follow-on scenarios. For example, you could use AppScope to test whether turning the VS Code telemetry off does in fact stop VS Code from sending all telemetry data. We could monitor to verify that VS Code stopped posting to https://vortex.data.microsoft.com/collect/v1, the “phone home” endpoint we observed in the HTTP events AppScope captured. Or we could look at other sent and received data, to see if any of it was of concern.
You could use AppScope to perform a fuller vetting, where you discover what processes the scoped process spawns; what files the app writes to, in what directories; the volume of network traffic to and from the app, what network calls are made using what protocols; what DNS entries the app requests; and what hosts the app communicates with. You could determine whether information was sent out over insecure channels. You could easily send the events and metrics from AppScope to Cribl LogStream and from there to Elastic or Splunk to visualize your results.
Does this alternative to the traditional application-vetting slog seem, perhaps, too good to be true?
Then try it for yourself! Kick the tires! Check out the docs! Join our #AppScope channel in Cribl Community Slack, where you can share how you’re using AppScope and what you discover with it.
We think you’ll find that working with AppScope is about easily capturing powerful observability data that has traditionally been painful or impossible to obtain. And, that this leads to better answers to hard questions about what’s going on in your system.